Nutritional monitoring and undernutrition
Resthome screens for undernutrition and tracks each resident’s intake, drawing on the geriatric ESPEN recommendations and on established screening thresholds. Everything is read in the resident record’s Nutrition tab and driven from the Meals dashboard.
The principle is simple: you enter the weight, the meals served and the drinks; Resthome derives an undernutrition risk status, targets for energy, protein and fluids, a coverage of intake, and raises alerts when a resident falls behind.
A screening tool, not a diagnosis
Nutritional monitoring helps the team spot frail residents early. It does not replace the assessment of a dietitian or a physician: the status and alerts are signals to be interpreted, not decisions.
The resident’s Nutrition tab
Open a resident (the Residents or Meals app), then the Nutrition tab. The tab only appears for residents. It brings together the undernutrition status, the latest MNA, the ESPEN targets, the intake, the diets and the food preferences.
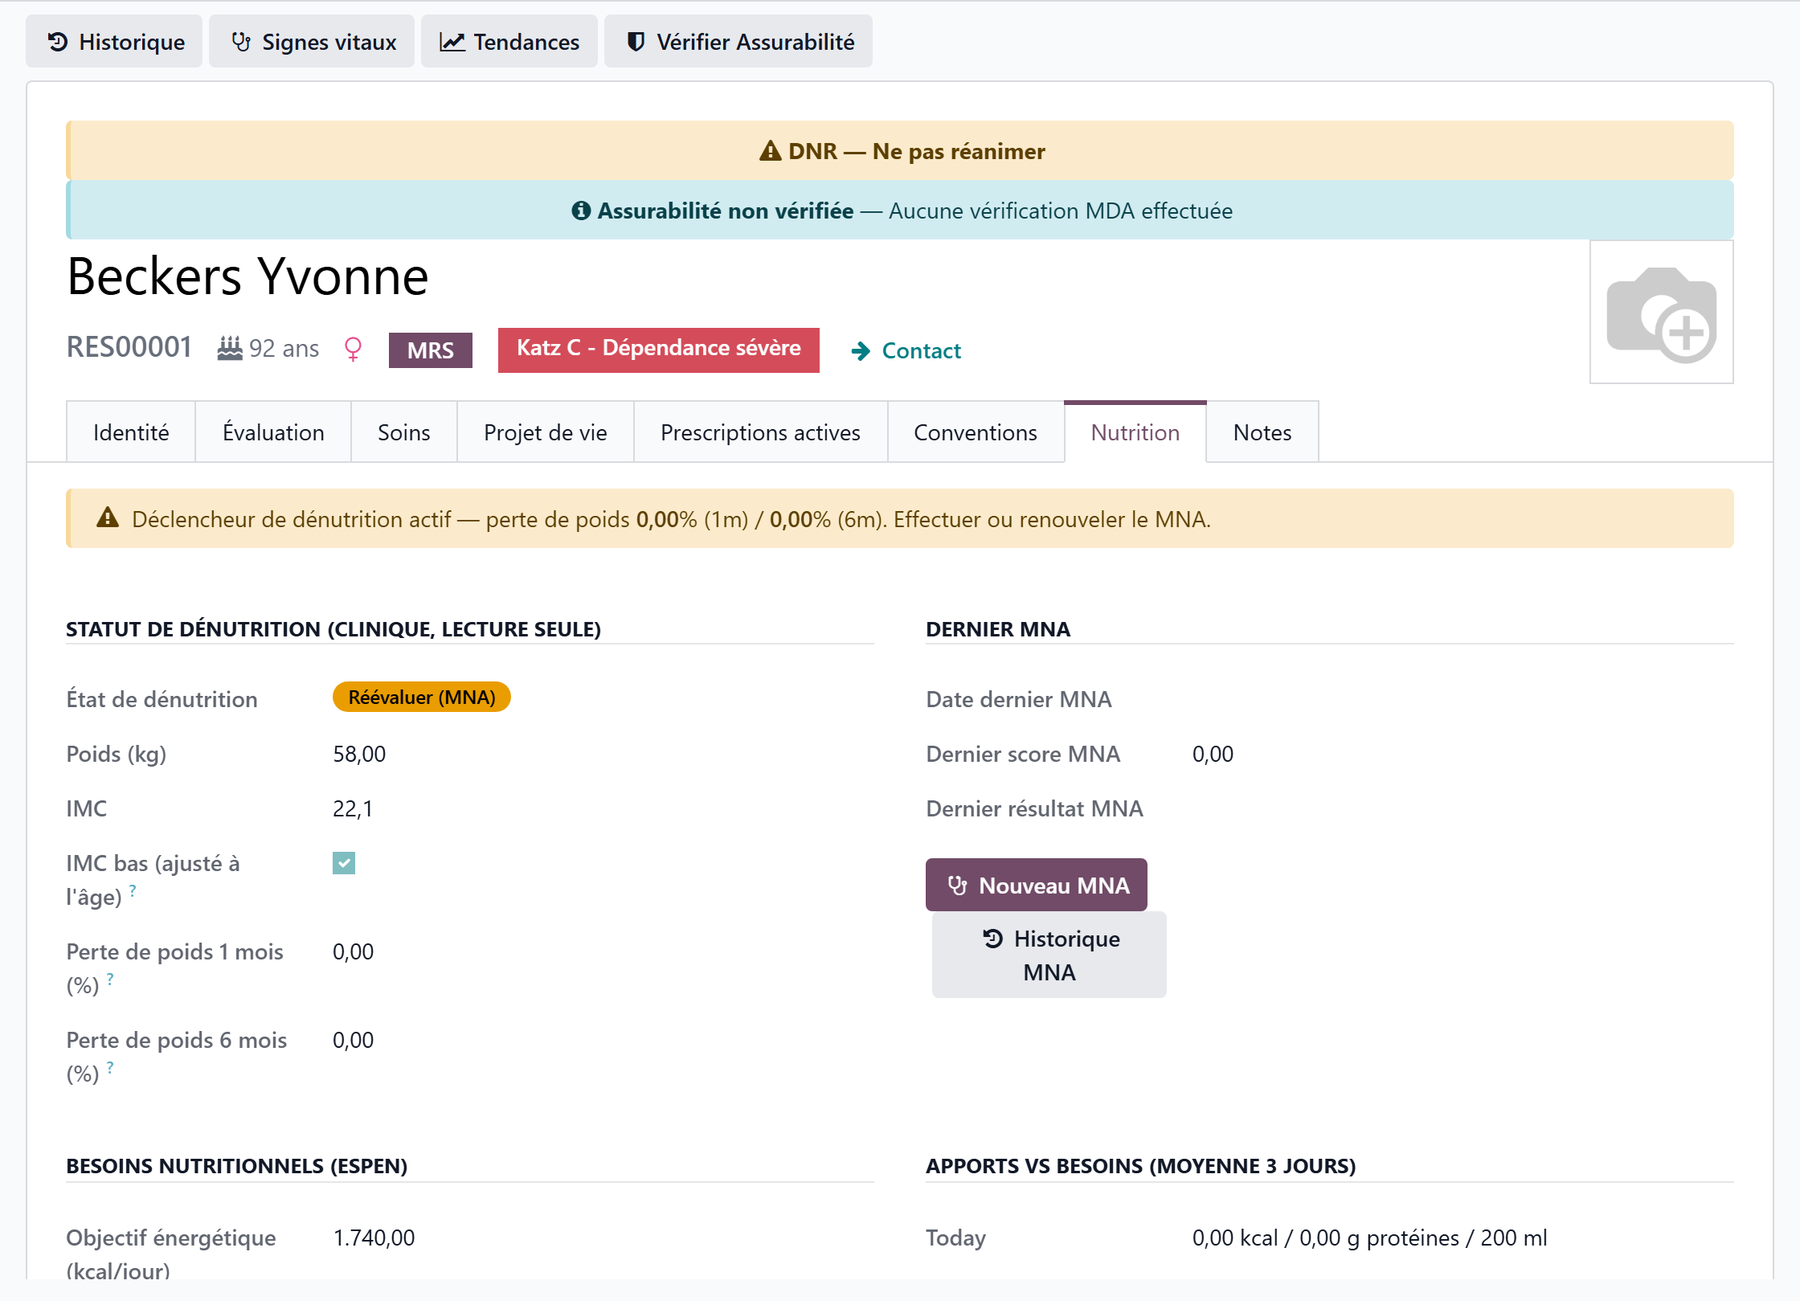
The undernutrition risk status
The Undernutrition Status block is read-only: Resthome computes it, you do not edit it by hand. It shows a colored badge and the measurements that explain it.
Displayed status |
Meaning |
Badge color |
|---|---|---|
No concern |
No concern |
Green |
To monitor |
To monitor (last MNA “at risk”) |
Blue |
Re-screen (MNA) |
A screening signal is active: redo or renew the MNA |
Orange |
Undernutrition |
Confirmed undernutrition (last MNA “undernourished”) |
Red |
Below the badge, the tab shows the weight, the BMI, a Low BMI indicator (age-adjusted low BMI) and the weight loss over 1 month and over 6 months.
flowchart TD
    A[Weight, height and BMI up to date] --> B{Last MNA = undernourished?}
    B -- Yes --> C[Undernutrition]
    B -- No --> D{Screening signal active?}
    D -- Yes --> E[Re-screen MNA]
    D -- No --> F{Last MNA = at risk?}
    F -- Yes --> G[To monitor]
    F -- No --> H[No concern]
What triggers “Re-screen (MNA)”
A screening signal is active as soon as one of these conditions is true:
weight loss of more than 5% over about 1 month;
weight loss of more than 10% over about 6 months;
BMI below 23 in a resident over 70 (age-adjusted threshold);
overdue MNA: no MNA, or a last MNA more than 6 months old.
In Belgium
These thresholds are the default values of the AViQ screening (PWNS-be-A). See Care in Belgium.
Weigh regularly to get the weight loss
The weight loss over 1 and 6 months is computed from the weights logged in the vital signs (nursing notes). Without regular weigh-ins, Resthome cannot compare and these percentages stay at zero. The height is required for the BMI.
The latest MNA
The Latest MNA block summarizes the resident’s most recent MNA (Mini Nutritional Assessment) assessment: date, score and interpretation (normal, at risk, undernourished).
Two buttons give access to it:
New MNA opens a new MNA assessment pre-filled for this resident, with the BMI band already selected based on their known BMI.
MNA History opens the list of their previous MNAs.
The MNA-SF is a 14-point scale: 12–14 = normal status, 8–11 = at risk of undernutrition, 0–7 = undernourished. It is the MNA that switches the status to Undernutrition or To monitor. The assessments are clinical registers: see Clinical registers.
The ESPEN targets
The Nutritional Needs (ESPEN) block shows the target specific to the resident, derived from their weight and sex:
Target |
How it is computed |
|---|---|
Energy Target (kcal/day) — energy |
Weight × 30 kcal/kg (or 35 if BMI less than or equal to 21) |
Protein Target (g/day) — protein |
Weight × 1 g/kg |
Fluid Target (ml/day) — fluids |
1600 ml (women) / 2000 ml (men) |
The coefficients (30/35 kcal, 1 g, 1.6/2.0 L) are set once for the whole facility in Meal and nutrition settings. Resthome then derives each resident’s individual target.
Intake vs needs (3-day average)
The Intake vs Needs block compares what the resident actually consumed with their targets.
The Today row shows the day’s intake: kcal, protein (g) and fluids (ml).
Three coverage bars — Energy Coverage, Protein Coverage and Fluid Coverage — give the 3-day average as a percentage of the target.
Two indicators, Nutrition Deficit and Hydration Deficit, become true when coverage falls below the configured threshold (75% by default).
Two buttons round out the block:
Log Drink quickly records a drink for this resident.
Hydration History opens their drinks log.
For coverage to fill in
Food intake comes from the meal services: at each meal, record the amount eaten (see below). The dishes must carry their portions and their per-portion values (kcal, protein), otherwise the intake stays at zero. Hydration comes from the logged drinks.
Logging food intake
Energy and protein intake is derived from the meal services. On a service, the Amount Eaten field offers: Not Eaten, 25%, 50%, 75% and Fully Eaten.
Resthome multiplies the per-portion nutritional value of the dishes served by this percentage to obtain the meal’s actual intake, then takes the 3-day average. Meal-by-meal entry is done in Meals → Operations (Meal services, Distribution) — see Menus, diets and hydration.
Recording hydration
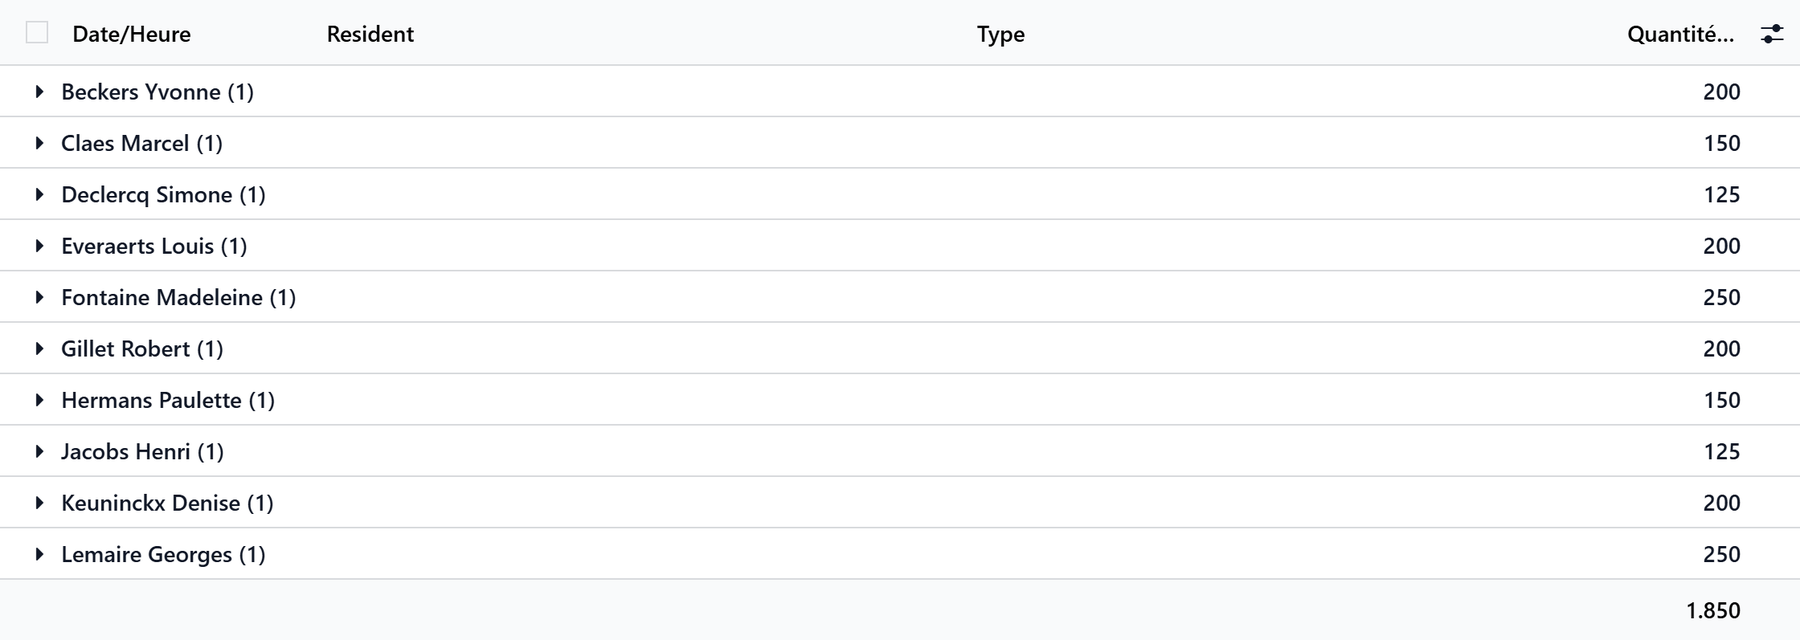
Drinks are logged throughout the day in Meals → Operations → Hydration, a directly editable list (quick entry). Each line records the resident, the time, the quantity in milliliters and the drink type: water, coffee/tea, juice/soda, milk/dairy, soup/broth, oral supplement, other.
You can also log a drink in one click from the Nutrition tab, with the Log Drink button. Resthome adds up the day’s drinks, computes the fluid coverage over 3 days and raises an alert if intake is insufficient.
The nutrition dashboard
Open Meals → Reporting → Statistics: below the general cards (Residents, Menus, Alerts), the page brings together three nutritional banners that only appear if they concern at least one resident.
Banner |
Residents concerned |
Button |
|---|---|---|
Undernutrition risk (red) |
Re-screen (MNA) or Undernutrition status |
Review opens the list of these residents |
Nutritional deficit (orange) |
Intake below the ESPEN target |
Review opens the list of these residents |
Hydration deficit (blue) |
Fluid intake below the target |
Review opens the list of these residents |
Each Review button opens the filtered list of residents, on their full record (Nutrition tab included) to act directly.
The automatic alerts
A daily cron refreshes the screening and creates activities for residents who fall behind. Activities are capped at once every 30 days per resident to avoid duplicates.
Alert |
Condition |
Recipient |
|---|---|---|
Undernutrition — redo/renew the MNA |
Re-screen (MNA) or Undernutrition status |
Head nurse, otherwise manager |
Nutritional deficit — intake below target |
Energy or protein coverage below the threshold |
Kitchen (dietitian), otherwise head nurse, otherwise manager |
Hydration deficit — fluid intake below target |
Fluid coverage below the threshold |
Kitchen (dietitian), otherwise head nurse, otherwise manager |
In addition to the activities, the Nutrition tab shows a warning banner at the top as soon as the status is Re-screen (MNA) or Undernutrition, recalling the weight loss and prompting to redo the MNA.
Set the deficit threshold
The 75% coverage threshold that triggers the deficit alerts is changed in Meal and nutrition settings. Lower it to be alerted later, raise it to be alerted earlier.
Key takeaways
The resident’s Nutrition tab brings together the undernutrition status, latest MNA, ESPEN targets and intake coverage — read-only for the computed measurements.
The undernutrition status follows the screening rules: weight loss, age-adjusted BMI, overdue MNA or “undernourished” MNA.
The targets (energy, protein, fluids) are specific to each resident, computed from their weight and sex using the configurable ESPEN coefficients.
The intake is derived from the amount eaten at meals and the logged drinks; coverage is a 3-day average.
The Meals dashboard (Statistics) and the daily alerts surface at-risk residents; this monitoring does not change the care allowance, which follows the dependency assessment.